Geographical and Gender Distribution of Individual Members of the International Astronomical Union
author: Vinicius Placco (http://vmplacco.github.io/)
permanent link: (http://vmplacco.github.io/projects/iau/)
This is a preliminary exploratory analysis combining data visualization techniques (using open source software - except for Tableau) with databases freely available online. The data source is the "geographical and gender distribution of individual members of the IAU" (International Astronomical Union). See the Reference section below for details.
The first (static) map shows the distribution of registered astronomers per country in the IAU database, as of September 27th, 2019. Darker colors relate to larger numbers of astronomers in a given country. Countries with light gray colors have no data available in the IAU database. Note: I did not filter data based on the IAU country categories.
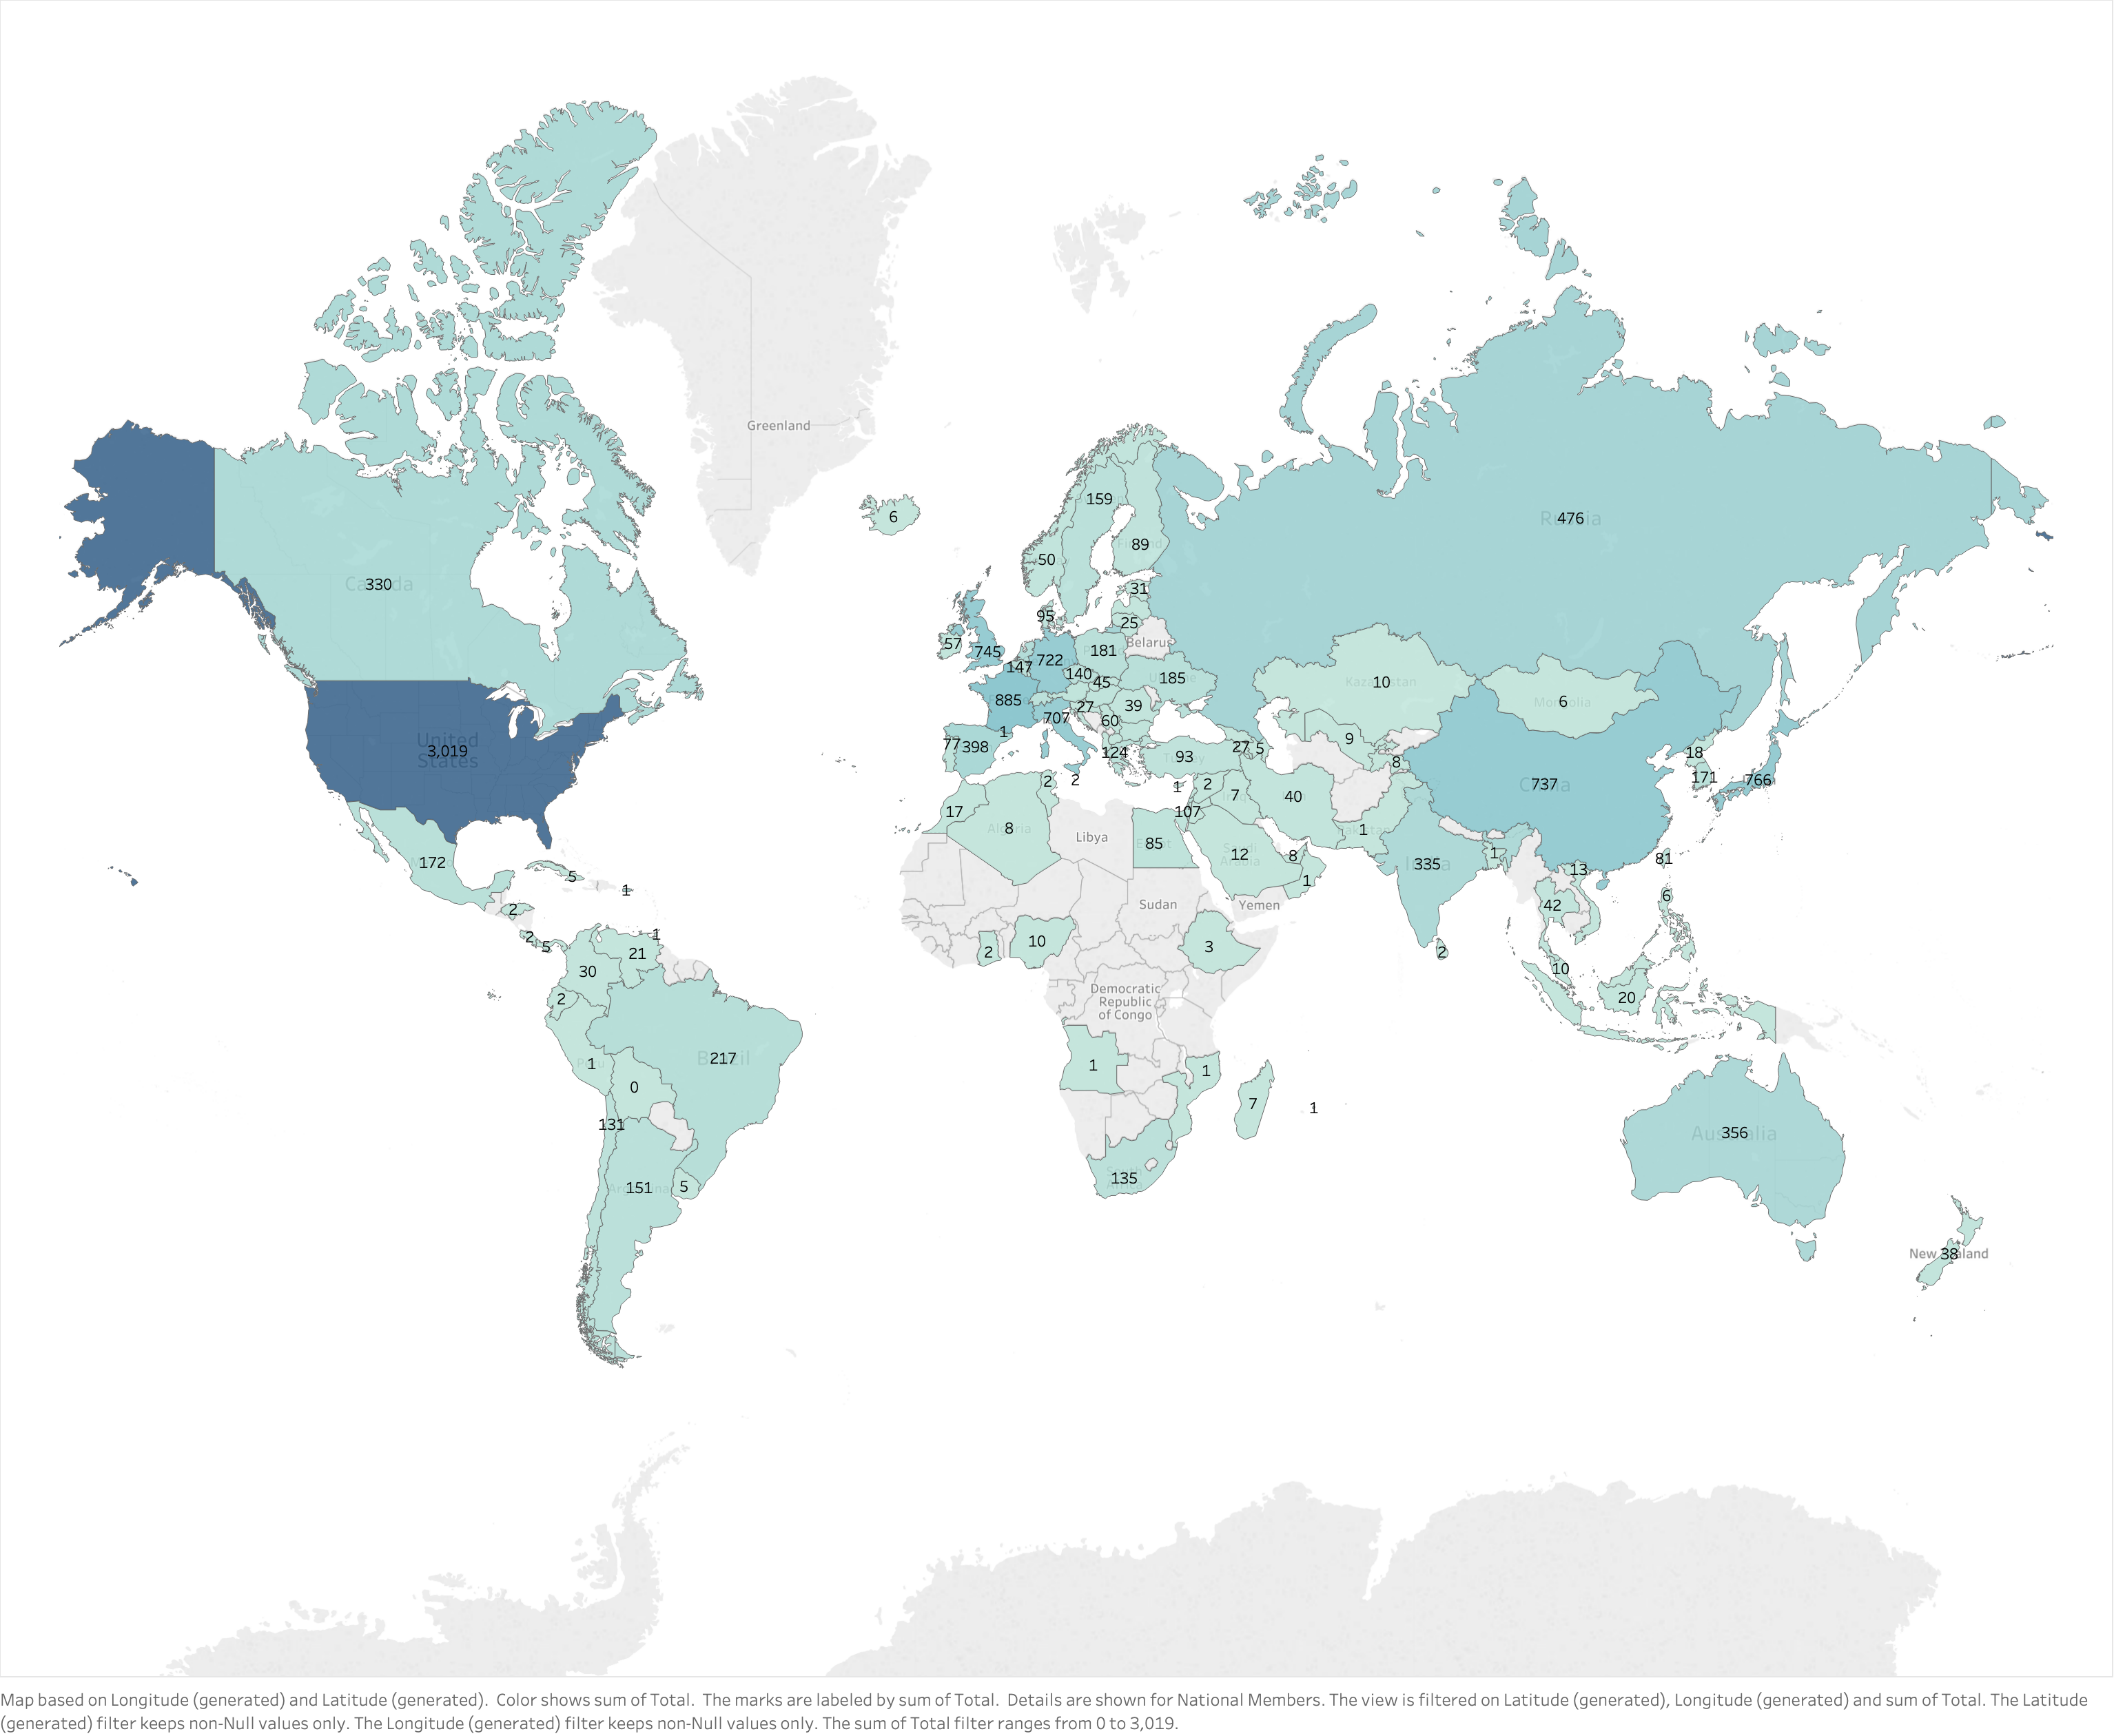
The interactive map below uses the same underlying data, but the color scale relates to the percentage of reported female astronomers. By hovering your mouse in each country you can find additional information.
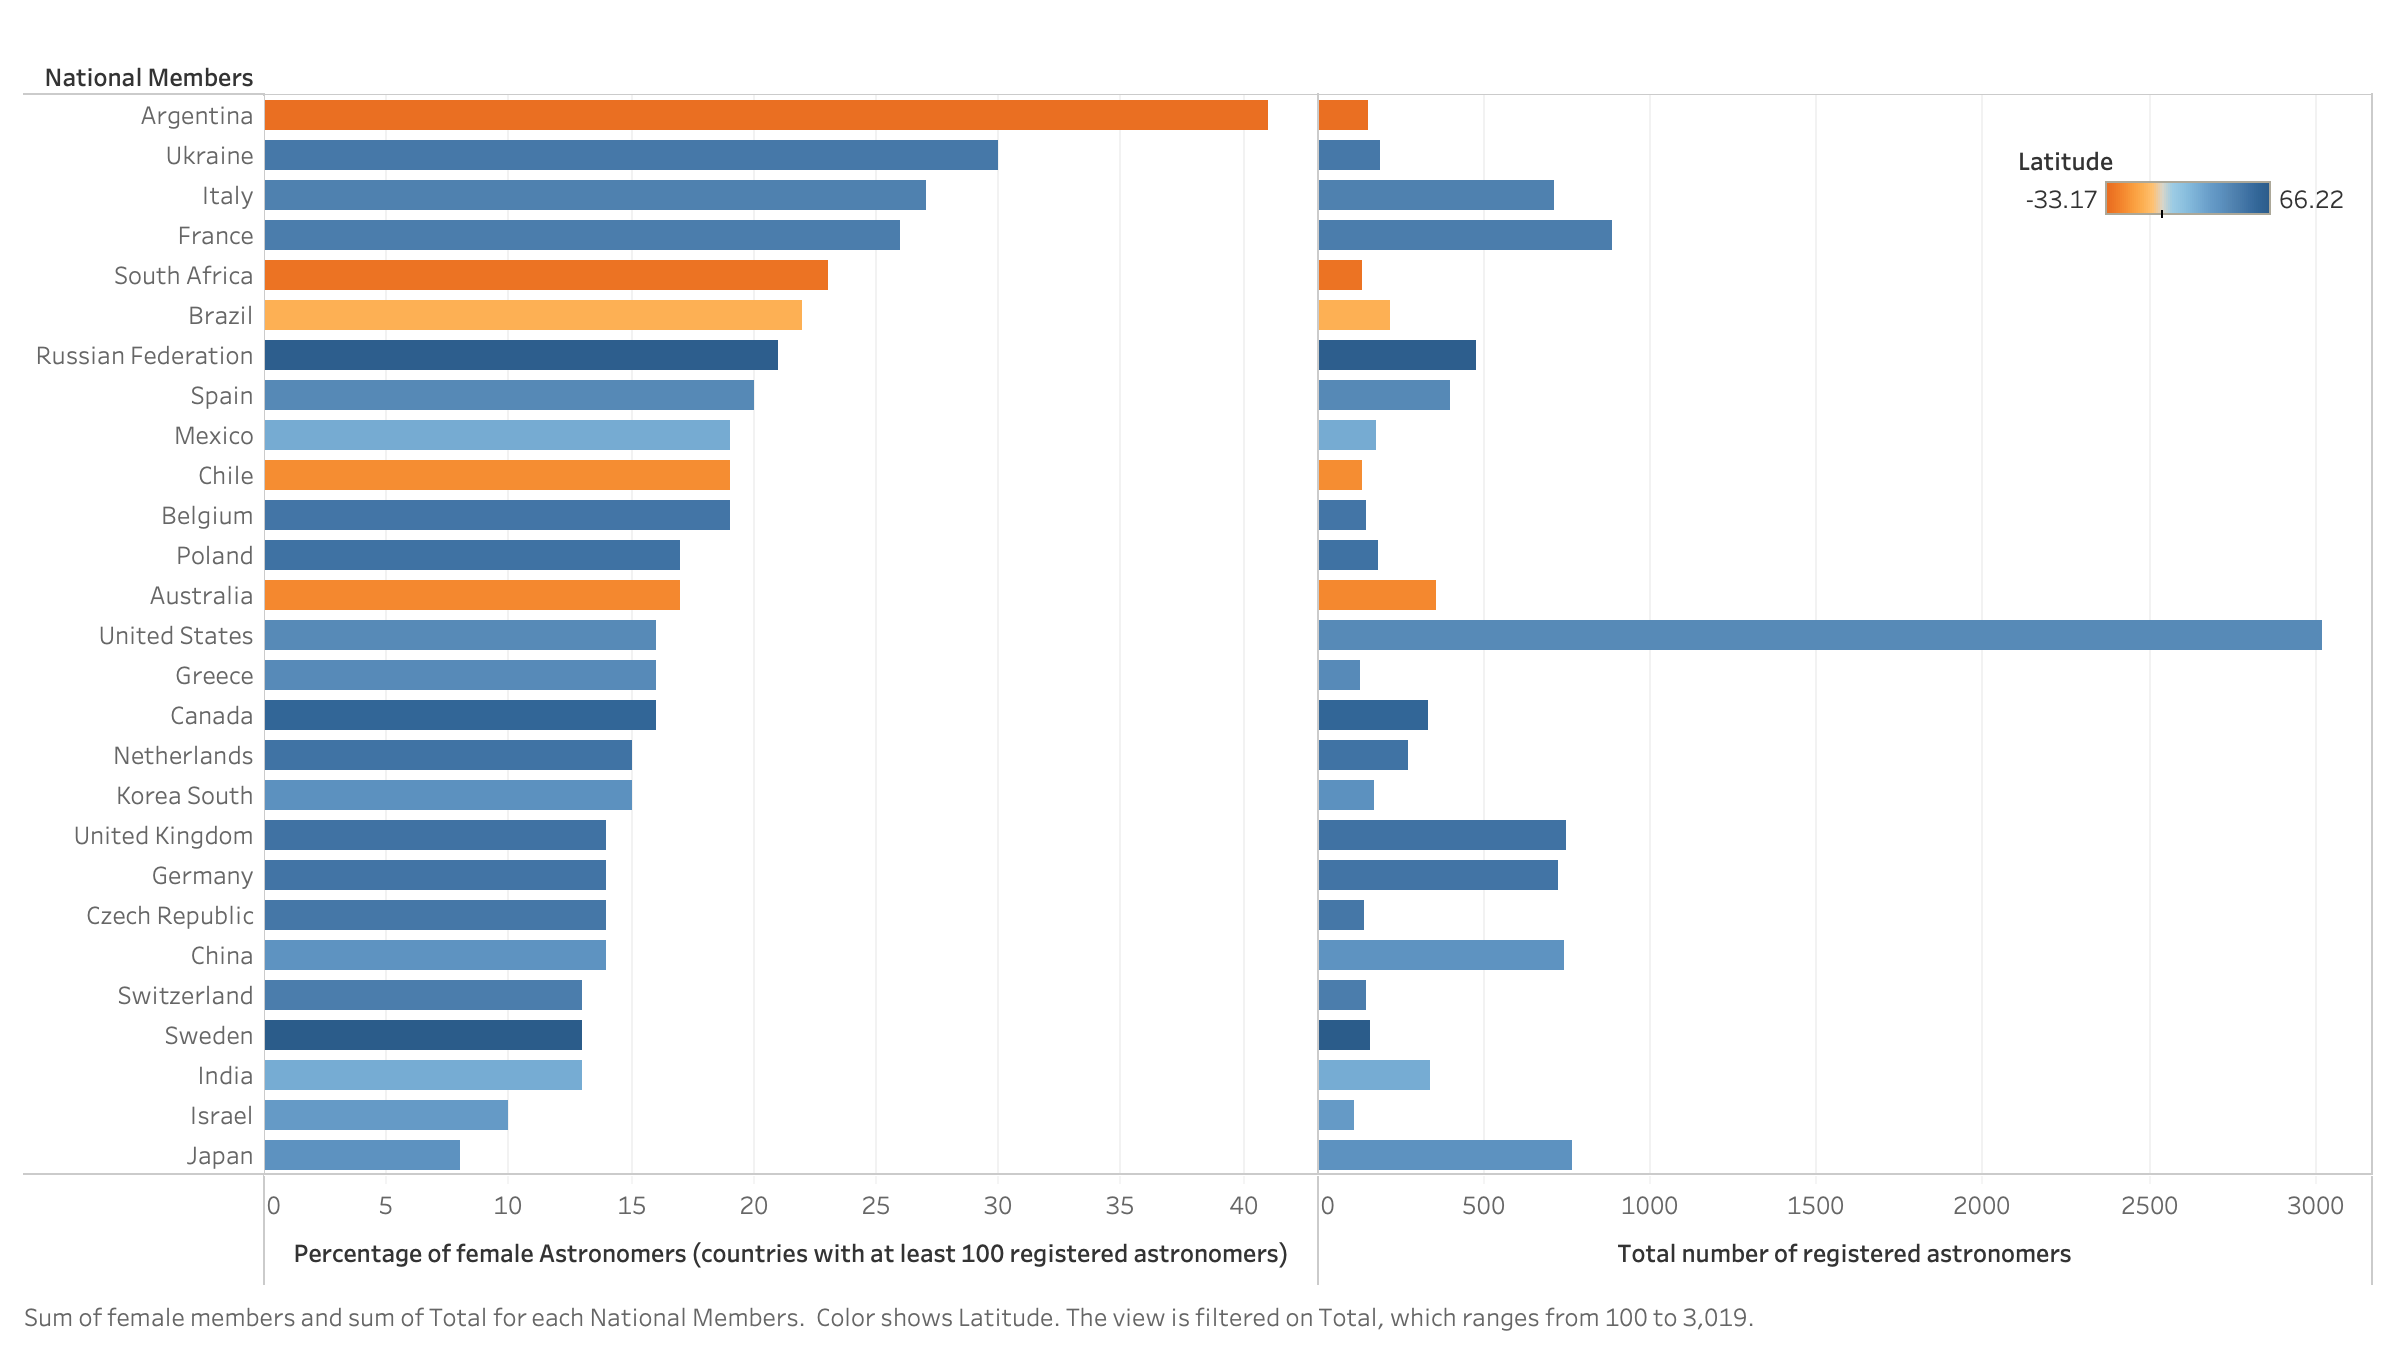
The horizontal bars (left side) in the figure below show the percentage of female astronomers for member countries with at least 100 registered astronomers. The right side shows the total number of astronomers for each country listed on the left side. The color scale relates to the latitude (a proxy for southern and northern hemispheres).
The IAU database also has limited information on the distribution of registered astronomers by gender and age group (for those members who reported such information). The last interactive figure below is a stacked vertical bar chart comparing the percentage of females and males for different age groups, as defined by the IAU. The detailed information for each group can be accessed by hovering your mouse on the vertical bars.
This work is for demonstration purposes only and has no relation/affiliation with the IAU. Any comments or suggestions are greatly appreciated and can be sent directly via email (vmplacco@gmail.com).
Resources:
- web scraping: bash (curl, awk, sed, cut, tr)
- static map: Tableau Desktop
- interactive map: python (pandas, numpy, pycountry, geopandas, json, geopy, bokeh)
- webpage: html, css, google analytics
References:
- Data source: https://www.iau.org/administration/membership/individual/distribution/ (September 27th, 2019)
- Bokeh example: https://towardsdatascience.com/a-complete-guide-to-an-interactive-geographical-map-using-python-f4c5197e23e0
- Stack Overflow: https://stackoverflow.com/